
Access to infrastructure is one of the biggest constraints to development in emerging and developing countries. Low access to critical infrastructure such as water and sanitation, electricity, and roads not only affect the socioeconomic wellbeing of households, but also the productivity of firms. Inequality in the distribution of infrastructure services, uneven quality, and affordability of services remain as major issues. A significant share of urban population in MICs face severe constraints in accessing quality and affordable infrastructure and critical services. However, data on the extent of the access, quality and affordability gaps are lacking or only available at the country level. Granular data at the subnational level is required to inform analysis and decision making.
The main objective of this dashboard is to facilitate access to a unique data platform that contains subnational level data on infrastructure access, quality, and affordability gaps, with particular emphasis on MICs where IFC operates. This information was collated and analyzed applying a consistent methodology to estimate access, quality, and affordability of infrastructure at subnational level. The purpose of the dashboard is to: (i) inform business development, impact assessment and strategy formulation at IFC, (ii) facilitate benchmarking within IFC AIMM Frameworks, (ii) set foundations to build a global database useful for policy, investment, and analytics.
The information displayed in the dashboard comes three sources: (i) harmonized household survey and census data from the World Bank (WB) Global Monitoring Database (GMD); (ii) Spatial data on road networks from Global Roads Inventory Project; and (iii) NASA’s Gridded Population of the World.
The WB GMD: is a platform that gathers and harmonizes household surveys and census data from around the world into single platform to allow comparability and monitoring of key socioeconomic trends around the world. The database essentially, “constructs globally comparable microdata across countries, regions and across years for global poverty monitoring and welfare measurement” (World Bank, 2019). The database is accessible to WBG staff via Datalibweb 1. Data on measures relating to water, sanitation, electricity, cooking and heating, housing, digital technologies, household assets (ownership of electric appliances, car, etc.) are drawn from the GMD into the constructed database. Table 1 in the annex, provides a list of the main indicators extracted from GMD 2
Global Roads Inventory Project (GRIP): GRIP is a global database on road networks of 222 countries.3 it' was constructed by consolidating spatial data collected from sources including multigovernmental organizations, NGOs, research institutes, governments and crowdsource initiatives (Meijer et al., 2018). It classifies roads by road type and surface pavement attributes. Road type categories are highways, primary roads, secondary roads, tertiary roads, local roads and unspecified. Road surface categories are paved, gravel, dirt/sand, steel, wood, grass and unspecified. Road surface categorization helps to differentiate roads environmental impact and seasonality because, for instance, highways have higher impact on the environment but all-season usability than unpaved roads.
Population data: The population data comes from Gridded Population of the World, version 4 (GPWv4) produced by NASA’s Socioeconomic Data and Applications Center (SEDAC). he extracted data in this project is population count for 2015. GPWv4 provides spatial explicit information on distribution of human population across the globe at a 30 arc second (approximately 1km at the equator) resolution. The georeferenced population data can be easily merged with georeferenced socioeconomic data and administrative boundaries. The essence of including the population data in the database is to allow users get a sense of the number of people living in the respective subnational regions and also assess the potential demand gap with respect to the various infrastructure availability.
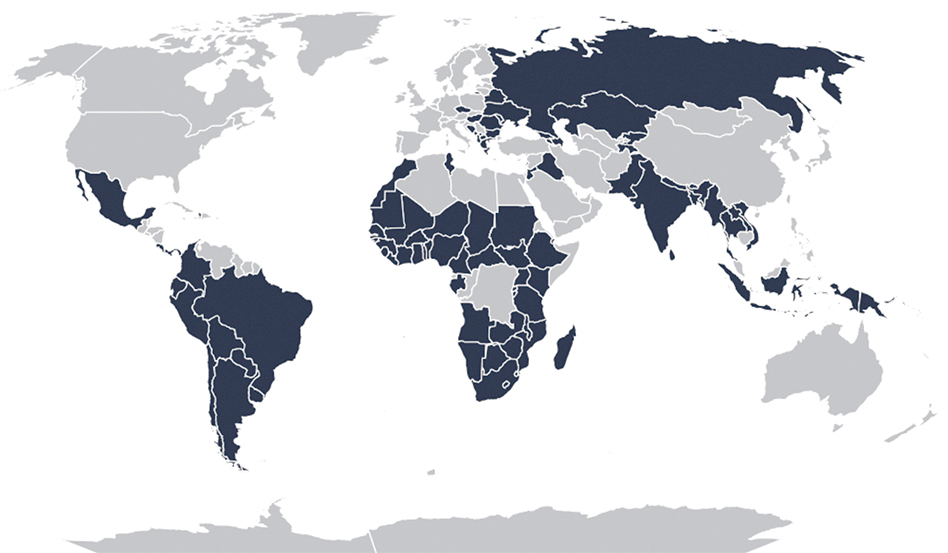
The dashboard contains information covering 1,410 subnational districts/regions from 107 countries.
Household (micro) data on infrastructure access: For each infrastructure group (i.e., sanitation, water, electricity, road, housing, digital technologies,) the data is categorized in three types of indicators: access, reliability of service, and affordability (proxied by expenditure) by households. The primary information is obtained from GMD household surveys data around the world, and to ensure consistency, the dashboard presents latest available household survey in the database as of 2022. Table 1 presents information on the survey name and year in from which the subnational infrastructure data were computed. For 68 (64%) countries in the database, the indicators are calculated on surveys collected between 2015 and 2020.
To ensure that the estimates of infrastructure access at the subnational level is representative of the population, the approach of the World Bank’s Global Subnational Atlas of Poverty (GSAP)4 adopted, matching the households (survey respondents) to the subnational districts. GSAP has produced the list of subnational boundaries for each survey country for which the household surveys are representative. In some countries these boundaries matches either (i) first administrative boundary; (ii) second administrative boundary; or a combination of both. For each of these subnational units, the population weighted average access/uptake rate for the respective infrastructure services is calculated. In addition, infrastructure access across heterogenous groups (e.g., rural vs. urban, welfare deciles) within the subnational is also computed. These classifications allow to assess the extent of inequalities in access to the various infrastructure across groups.
Roads: For each subnational unit and road class, the total road length (km) and density (km/km2) for the various road classes is extracted and used 5.
Population: For each subnational unit, the total population and the population density (per square km) is used for calculations.
Indicators at national and subnational level: indicators on access, reliability of service, and affordability are calculated at the subnational level. The database also presents the same indicators at the national level, based on national averages for ease of comparison.
| Category | Definition |
|---|---|
| Asset | Renting (home) |
| Asset | Free occupancy (home) |
| Asset | Home ownership via inheritance |
| Asset | Home ownership via other means |
| Asset | Home ownership via purchased |
| Asset | No. of rooms in dwelling |
| Asset | Dwelling has separate kitchen |
| Asset | HH has separate bathroom in dwelling |
| Asset | Total floor area (m sq) of dwelling |
| Asset | Type of dwelling-apartment |
| Asset | Type of dwelling-detached house |
| Asset | Type of dwelling-impoverished housing |
| Asset | Type of dwelling-other housing |
| Asset | Type of dwelling-Room in a larger building |
| Asset | Type of dwelling-Several buildings connected |
| Asset | Expenditure on materials, maintenance and repair of dwelling |
| Asset | Expenditure on minor maintenance and repair of dwelling |
| Asset | Expenditure on other maintenance and repairs of dwelling |
| Asset | Expenditure on services related to dwelling |
| Asset | Access to washing machine at home |
| Asset | Bicycle Ownership |
| Asset | Car Ownership |
| Asset | Access to referigerator at home |
| Asset | Ownership of electric fan |
| Asset | Ownership of air condition |
| Asset | Access to a computer |
| Asset | Access to TV at home |
| Digital | Renting (home) |
| Digital | Access to landline phone |
| Digital | Access to mobile phone |
| Digital | Access to electronic tablet |
| Digital | Access to mobile/landline phone |
| Digital | Access to Internet |
| Digital | Access to TV at home |
| Digital | Access to a computer |
| Digital | Expenditure on landline phone usage |
| Digital | Expenditure on mobile phone usage |
| Digital | Expenditure on telephone services (mobile + landline) |
| Digital | Expenditure on Internet services |
| Digital | Expenditure on Communication services (mobile, landline, fax, internet) |
| Digital | Expenditure on TV broadcast services |
| Electricity | Access to electricity |
| Electricity | Electricity availability (hr/day) |
| Electricity | Expenditure on electricity |
| Heat | Access to central heating in dwelling |
| Heat | Firewood as main cooking fuel |
| Heat | Kerosene as main cooking fuel |
| Heat | Charcoal as main cooking fuel |
| Heat | Electricity as main cooking fuel |
| Heat | LPG/LNG for cooking |
| Heat | Other sources of cooking fuel |
| Heat | Expenditure on natural/town gas |
| Heat | Expenditure on LPG |
| Heat | Expenditure on (all) gas |
| Heat | Expenditure on diesel |
| Heat | Expenditure on kerosene |
| Heat | Expenditure on other liquid fuels (heating, black and lighting oil) |
| Heat | Expenditure on all liquid fuels |
| Heat | Expenditure on wood |
| Heat | Expenditure on coal |
| Heat | Expenditure on peat |
| Heat | Expenditure on other solid fuels such as agricultural residue and charcoal |
| Heat | Expenditure on solid |
| Heat | Expenditure on other fuels (excl other solid & other liquid fuels) |
| Heat | Expenditure on central heating |
| Heat | Expenditure on heating |
| Heat | Expenditure on gasoline |
| Sanitation | Access to improved sanitation (flush toilet, VIP laterine, covered pit laterine with slab, uncovered pit laterine with a slab, compost toilet) |
| Sanitation | Access to solid waste collection services |
| Sanitation | Disposal of solid waste in local dump site |
| Sanitation | Disposal of solid waste by burning |
| Sanitation | Disposal of solid waste into water bodies |
| Sanitation | Usage of other forms of waste disposal |
| Sanitation | Regularity of waste collection by municipal waste collectors |
| Sanitation | Access to a toilet connected to a piped sewer |
| Sanitation | Practicing of open defecation |
| Sanitation | Access to a flush toilet |
| Sanitation | Expenditure on collection and disposal of garbage/refuse |
| Sanitation | Expenditure on collection and disposal of wastewater |
| Sanitation | Expenditure on garbage and sewage collection/disposal |
| Water | Access to improved water (centralized water supply, spring water, wells, own system of water supply, delivered/imported water, bought water, rainwater) |
| Water | Reliable Access to improved water (i.e. improved water is available 24/7) |
| Water | Access to piped water |
| Water | Access to piped water in dwelling |
| Water | Reliance on bottled water as main source of drinking water |
| Water | Expenditures on water supply/piped water |
| Water | Expenditure on water supply and hot water supply |
| Road | Total road length (km) |
| Road | Length of primary roads (km) |
| Road | Length of secondary roads (km) |
| Road | Length of tertiary roads (km) |
| Road | Length of local roads (km) |
| Road | Length of highways (km) |
| Road | Total length of paved roads (km) |
| Road | Total road density (km/km2) |
| Road | Density of primary roads (km/km2) |
| Road | Density of secondary roads (km/km2) |
| Road | Density of tertiary roads (km/km2) |
| Road | Density of local roads (km/km2) |
| Road | Density of highways (km/km2) |
| Road | Total length of paved roads (km/km2) |
| Road | Share of total roads paved |
| Population | Number of people living in the subnational region (in 2015) |
| Population | Number of people per km2 in the subnational region (in 2015) |
| Region | Economy | Survey Year | Number of Areas |
|---|---|---|---|
| Africa | Djibout | 2017 | 6 |
| Africa | Egypt, Arab Rep. | 2017 | 4 |
| Africa | Morocco | 2013 | 12 |
| Africa | Tunisia | 2015 | 7 |
| Africa | Angola | 2018 | 19 |
| Africa | Burundi | 2013 | 17 |
| Africa | Benin | 2015 | 12 |
| Africa | Burkina Faso | 2014 | 13 |
| Africa | Botswana | 2015 | 7 |
| Africa | Central African Republic | 2008 | 7 |
| Africa | Côte d'Ivoire | 2015 | 14 |
| Africa | Cameroon | 2014 | 10 |
| Africa | Congo, Dem. Rep. | 2012 | 11 |
| Africa | Congo, Rep. | 2011 | 12 |
| Africa | Comoros | 2013 | 3 |
| Africa | Cabo Verde | 2015 | 9 |
| Africa | Ethiopia | 2015 | 11 |
| Africa | Gabon | 2017 | 7 |
| Africa | Ghana | 2016 | 10 |
| Africa | Guinea | 2012 | 8 |
| Africa | Gambia, The | 2015 | 8 |
| Africa | Guinea-Bissau | 2010 | 9 |
| Africa | Kenya | 2015 | 47 |
| Africa | Liberia | 2016 | 16 |
| Africa | Lesotho | 2017 | 10 |
| Africa | Madagascar | 2012 | 22 |
| Africa | Mali | 2009 | 9 |
| Africa | Mozambique | 2014 | 11 |
| Africa | Mauritania | 2014 | 13 |
| Africa | Mauritius | 2017 | 10 |
| Africa | Malawi | 2016 | 28 |
| Africa | Namibia | 2015 | 13 |
| Africa | Niger | 2014 | 8 |
| Africa | Nigeria | 2018 | 36 |
| Africa | Rwanda | 2016 | 30 |
| Africa | Sudan | 2014 | 18 |
| Africa | Senegal | 2011 | 14 |
| Africa | Sierra Leone | 2018 | 13 |
| Africa | South Sudan | 2009 | 10 |
| Africa | São Tomé and Principe | 2017 | 2 |
| Africa | Eswatini | 2016 | 4 |
| Africa | Seychelles | 2013 | 6 |
| Africa | Chad | 2011 | 20 |
| Africa | Togo | 2015 | 6 |
| Africa | Tanzania | 2018 | 26 |
| Africa | Uganda | 2016 | 4 |
| Africa | South Africa | 2014 | 9 |
| Africa | Zambia | 2015 | 10 |
| Africa | Zimbabwe | 2017 | 10 |
| EAP | Fiji | 2013 | 4 |
| EAP | Micronesia, Fed. Sts. | 2013 | 4 |
| EAP | Indonesia | 2018 | 33 |
| EAP | Lao PDR | 2018 | 4 |
| EAP | Myanmar | 2017 | 5 |
| EAP | Papua New Guinea | 2009 | 5 |
| EAP | Solomon Islands | 2012 | 1 |
| EAP | Thailand | 2019 | 77 |
| EAP | Timor-Leste | 2014 | 5 |
| EAP | Tonga | 2015 | 1 |
| EAP | Tuvalu | 2010 | 1 |
| EAP | Vietnam | 2018 | 6 |
| EAP | Vanuatu | 2010 | 6 |
| EAP | Samoa | 2008 | 2 |
| Europe | Albania | 2017 | 12 |
| Europe | Armenia | 2020 | 11 |
| Europe | Azerbaijan | 2005 | 10 |
| Europe | Bulgaria | 2019 | 2 |
| Europe | Bosnia and Herzegovina | 2011 | 3 |
| Europe | Belarus | 2020 | 7 |
| Europe | Czech Republic | 2019 | 8 |
| Europe | Georgia | 2020 | 10 |
| Europe | Greece | 2019 | 4 |
| Europe | Hungary | 2019 | 3 |
| Europe | Moldova | 2018 | 4 |
| Europe | North Macedonia | 2019 | 8 |
| Europe | Montenegro | 2017 | 4 |
| Europe | Romania | 2016 | 1 |
| Europe | Russian Federation | 2015 | 81 |
| Europe | Ukraine | 2020 | 25 |
| Europe | Kosovo | 2017 | 7 |
| LAC | Argentina | 2019 | 24 |
| LAC | Bolivia | 2019 | 9 |
| LAC | Brazil | 2019 | 27 |
| LAC | Chile | 2017 | 16 |
| LAC | Colombia | 2019 | 24 |
| LAC | Costa Rica | 2019 | 6 |
| LAC | Ecuador | 2019 | 24 |
| LAC | Haiti | 2012 | 10 |
| LAC | Mexico | 2018 | 32 |
| LAC | Panama | 2018 | 13 |
| LAC | Peru | 2019 | 25 |
| LAC | Paraguay | 2019 | 8 |
| LAC | Uruguay | 2019 | 19 |
| MCT | Kazakhstan | 2018 | 16 |
| MCT | Kyrgyz Republic | 2020 | 9 |
| MCT | Tajikistan | 2015 | 5 |
| MCT | Iraq | 2012 | 18 |
| MCT | Jordan | 2010 | 4 |
| MCT | Lebanon | 2011 | 6 |
| MCT | Yemen, Rep. | 2014 | 22 |
| MCT | Pakistan | 2018 | 4 |
| SAR | Bangladesh | 2016 | 8 |
| SAR | Bhutan | 2017 | 20 |
| SAR | India | 2011 | 35 |
| SAR | Sri Lanka | 2012 | 25 |
| SAR | Maldives | 2016 | 21 |
| SAR | Nepal | 2010 | 5 |